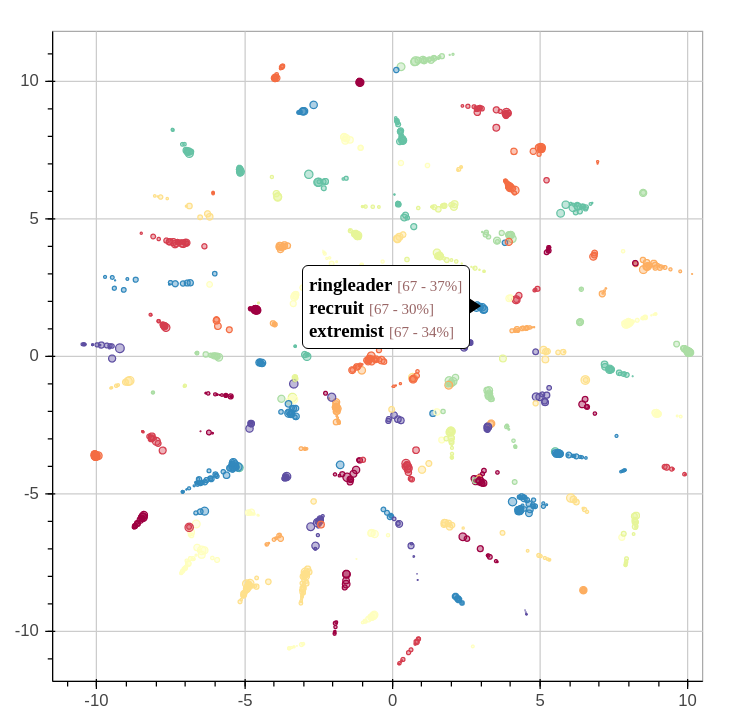
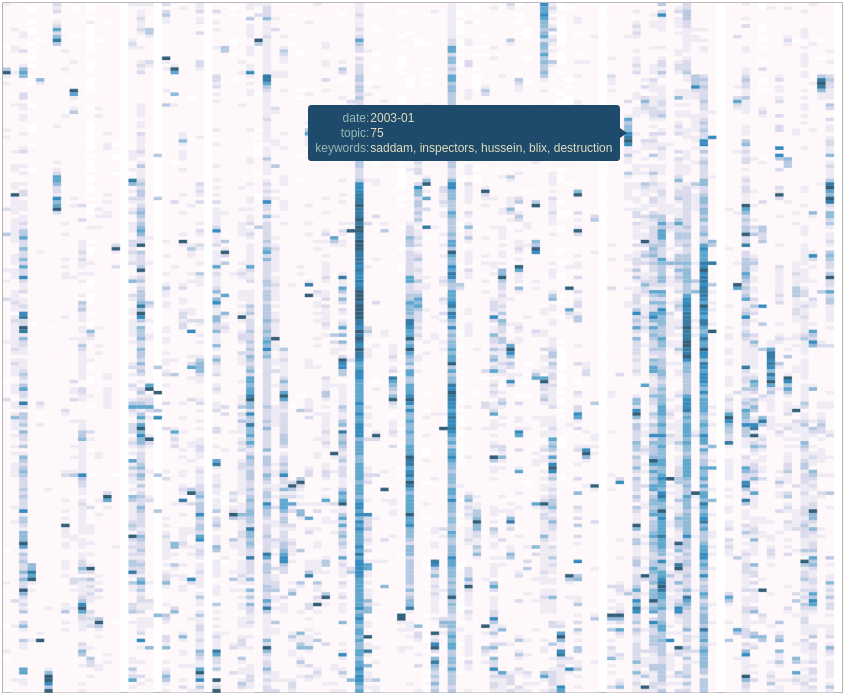
By extracting several topics from our news corpus, we gained a 10,000 feet view of corpus. We were able to outline many trends and events, but it took a bit of digging. This article will illustrate how the topics relate each to one another. We’ll even throw a bit of animation to take a look back the last 15 years.
When we extracted the topics from the corpus, we also found another way to describe all the news snippets and words. Instead of seeing a document as a collection of words, we could see it as a mixture of topics. We could also do the same thing with topics: every topics is a mixture of words used in its associated fragments.
Continue reading “15 Years of News – Analyzing CNN Transcripts: Visualizing Topics”
Tag: LDA
15 Years of News – Analyzing CNN Transcripts: Topics
As we saw in the previous article, temporal analysis of individual keywords can be very interesting and uncover interesting trends, but it can be difficult to get an overview of a whole corpus. There’s just too much data.
One solution would be to group similar subjects together. This way, we could scale down a corpus of 500,000 keywords to a handful of topics. Of course, we’ll be losing some definition, but we’ll be gaining a 10,000 feet view of the corpus. In all cases, we can always refer to the individual keywords if we want to take a closer look. Continue reading “15 Years of News – Analyzing CNN Transcripts: Topics”
A Map of the Geographic Structure of Wikipedia Topics
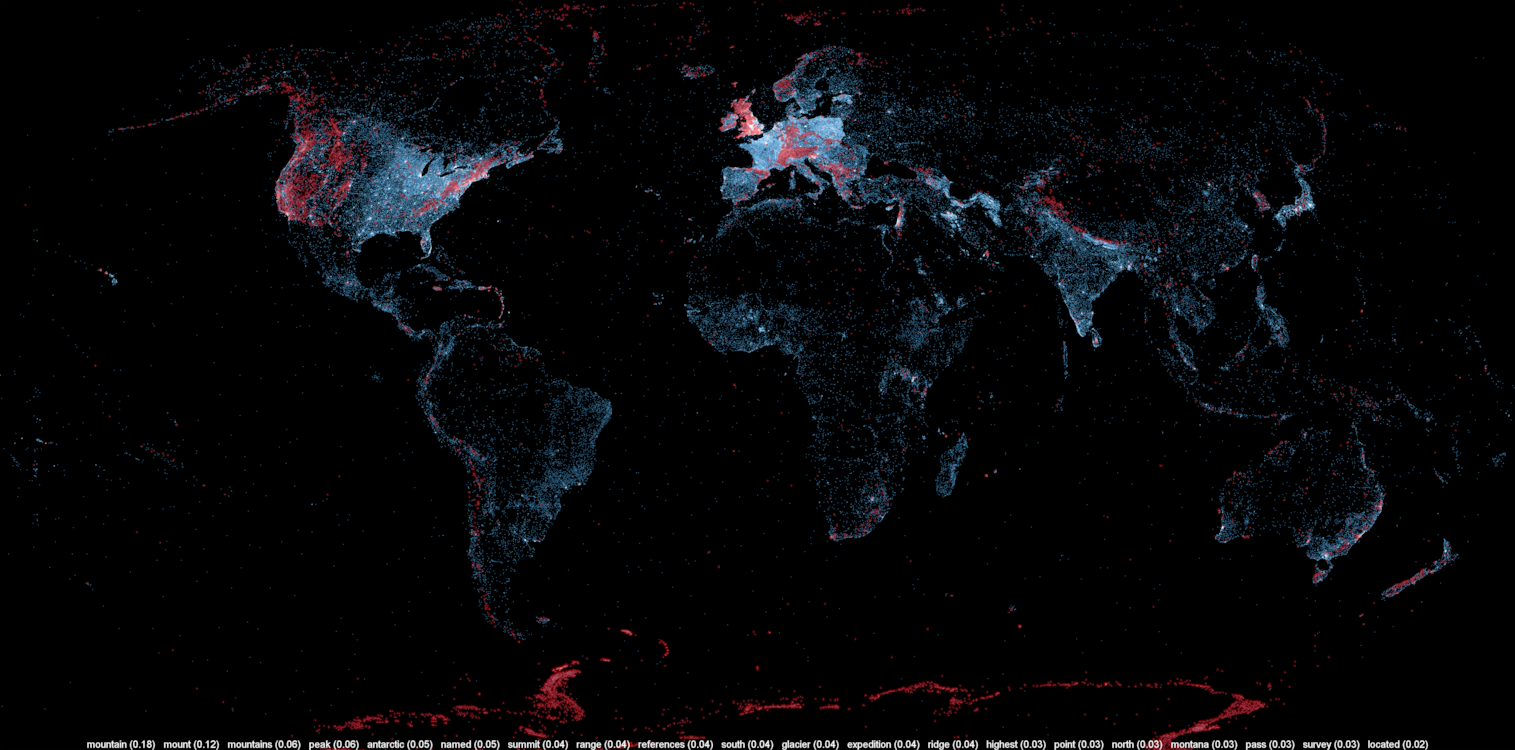
A large number of Wikipedia articles are geocoded. This means that when an article pertains to a location, its latitude and longitude are linked to the article. As you can imagine, this can be useful to generate insightful and eye-catching infographics. A while ago, a team at Oxford built this magnificent tool to illustrate the language boundaries in Wikipedia articles. This led me to wonder if it would be possible to extract the different topics in Wikipedia.
This is exactly what I managed to do in the past few days. I downloaded all of Wikipedia, extracted 300 different topics using a powerful clustering algorithm, projected all the geocoded articles on a map and highlighted the different clusters (or topics) in red. The results were much more interesting than I thought. For example, the map on the left shows all the articles related to mountains, peaks, summits, etc. in red on a blue base map. The highlighted articles from this topic match the main mountain ranges exactly.
Read on for more details, pretty pictures and slideshows.
Continue reading “A Map of the Geographic Structure of Wikipedia Topics”