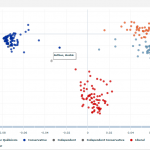
 Less visually striking than my last project, this visualization shows the voting patterns of Canadian Members of Parliament. It uses a Principal Component Analysis (or PCA) transformation to convert the multidimensional voting record of each MP to a 2D (or Cartesian) form.
Each point on the chart represents an MP. The color of every MP follows their party affiliation. They are tightly clustered because of party discipline : in Canada, MPs normally vote in accordance to directions given by the Prime Minister.
Continue reading “Legislative Explorer | Multidimensional Vote Explorer”
