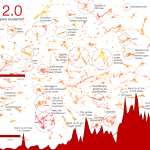
 Après plus de 100 jours et plusieurs centaines de milliers de tweets, le paysage médiatique et politique de la grève a bien changé. Quelques personnes sur twitter, facebook, par courriel ou de vive voix m’ont suggéré de mettre à jour la première visualisation avec des données plus récentes.
C’est ce que j’ai fait. En cliquant sur l’image, vous devriez obtenir l’image agrandie. Sinon, en cliquant ici, vous pourrez télécharger une version vectorielle en haute-résolution.
J’ai également fait une petite étude sur l’évolution des sujets (extraits algorithmiquement) présents dans les tweets traitant de la grève. On remarque que certains sujets sont transitoires et d’autres plus permanents.
Continue reading “Visualisation de la #GGI – Mise à jour!”
Tag: viz
Visualisation – Structure d'influence du conflit étudiant
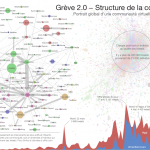 Depuis plus de 100 jours, les étudiants et le gouvernement s’affrontent dans les médias traditionnels et les médias sociaux. Les médias sociaux nous offrent la chance d’analyser l’opinion publique sans passer par de coûteux sondages. Évidemment, cette méthode comporte des biais. Par exemple, les individus plus politisés sont bien plus présents sur les médias sociaux. Néanmoins, les médias sociaux demeurent une façon extrêmement intéressante d’analyser les mouvements sociaux à un niveau très désagrégé, soit au niveau des individus.
L’infographie précédente caractérisait le contenu des tweets, celle-ci s’attarde plutôt à la structure des interactions entre les individus. Comme dans l’infographie précédente, un histogramme illustre le nombre de tweets publiés par jour selon différents mots-clics (soit tous les tweets, #manifencours et #casseroles). Il est important de mentionner que les histogrammes sont normalisés, c’est-à-dire que pour chaque histogramme, la valeur maximale est utilisée pour pondérer chaque graphe. Cette méthodologie permet d’illustrer efficacement les variations de chaque série.
Une version haute-résolution en format PDF est disponible ici.
Continue reading “Visualisation – Structure d'influence du conflit étudiant”
Visualisation des tweets de la grève étudiante
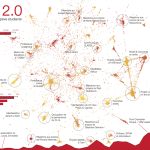 Peu importe l’opinion que l’on peut avoir sur la grève, il n’en demeure pas moins qu’elle doit être la grève la plus “tweeté” de l’histoire québécoise. Il s’agit donc d’une chance inégalée d’analyser ce mouvement social.
J’ai donc conçu cette petite infographie à l’aide de tweets que j’ai capturés. J’ai utilisé les hashtags suivants pour intercepter les tweets ayant comme sujet la grève: #ggi #non1625 et #22mar.
Il est possible de télécharger une version PDF en haute résolution de cette infographie [en cliquant ici].
Continue reading “Visualisation des tweets de la grève étudiante”
Scientific collaborations by Metropolitan Statistical Areas
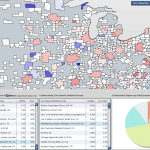 I had a lot of positive feedback last year when I designed my map of scientific collaborations. I think that there were two main reasons for this interest. First of all, the map was visually striking; it was abstract but it could still convey useful information about the world. Secondly, I think that the interest that people have in maps is mainly egocentric. In other words, the first thing that we look for when looking at a map, is to see where and how our house, state, country, etc. are represented on that map.
This time I wanted to design a much more detailed map, one that could help to make decisions or help understand scientific collaborations. The USA is a very interesting country because they fund science in such a massive way. Also, the United States is a land of contrasts where no two states are alike and this makes for interesting comparisons. Continue reading “Scientific collaborations by Metropolitan Statistical Areas”
Contributing Communities on Wikipedia
 This summer I was contacted by Goodby, Silverstein & Partners, a Californian Ad Agency in San Francisco working with Adobe Systems. GS&P hired me to design an interactive visualization for their Museum of Digital Media to illustrate how people contribute to Wikipedia and how these contributors form communities.
This was a challenge I could not refuse.
Mapping Political Financing in Montréal
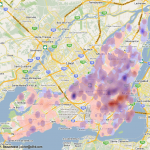 Using the data cleaned and released by Cedric Sam and Thomas de Lorimier (available on Cyberpresse), I geocoded the data and applied a density map function. The map shows interesting financial patterns in Montréal for the Bloc Québecois and for the Liberal Party of Canada. I’ve chosen those two parties since they have a strong historical influence in Montréal. As we can see on the map, the western part of Montréal is clearly Liberal while the east is more aligned with the Bloc Québécois.
The most interesting clusters are on both sides of Mount Royal. One side, situated in Westmount, contributes noticeably to the PLC while the other side, in Outremont, donates more to the Bloc Québec. To anybody living in Montréal, it’s hardly a surprising fact, but I think it’s nice to see it on a map.
Content Analysis of the Leaders' English Debate
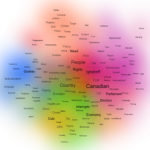 Le débat des chefs offre l’occasion de faire des analyses de contenus très intéressantes. En effet, les politiques des partis et les opinions des chefs sont condensées et distillés à l’extrême. Il est donc possible de brosser un tableau impressionniste des préoccupations canadiennes (ou du moins, celle des chefs). Malheureusement, la transcription du débat francophone n’est pas disponible; alors, l’analyse portera sur le débat anglophone.
The leaders’ debate is a golden opportunity to measure the Canadian political landscape as the primary talking points of the leaders and their parties are condensed into a manageable size. Using the transcript of the debate, I used a co-word analysis to try to extract the gist of the debate. I think the resulting maps are interesting and can shed light on current political trends.
Continue reading “Content Analysis of the Leaders' English Debate”
Legislative Explorer | Multidimensional Vote Explorer
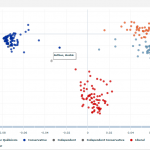 Less visually striking than my last project, this visualization shows the voting patterns of Canadian Members of Parliament. It uses a Principal Component Analysis (or PCA) transformation to convert the multidimensional voting record of each MP to a 2D (or Cartesian) form.
Each point on the chart represents an MP. The color of every MP follows their party affiliation. They are tightly clustered because of party discipline : in Canada, MPs normally vote in accordance to directions given by the Prime Minister.
Continue reading “Legislative Explorer | Multidimensional Vote Explorer”
Map of scientific collaboration between researchers
 I was very impressed by the friendship map made by Facebook intern, Paul Butler and I realized that I had access to a similar dataset at Science-Metrix (an old employer I left a while ago). Instead of a database of friendship data, I had access to a database of scientific collaborations. Bibliometric firms use this kind of data to get a (very) approximated view of science, but I thought that for a data visualization, it was good enough
This post is now obsolete, please see the new one (click here!)
Continue reading “Map of scientific collaboration between researchers”