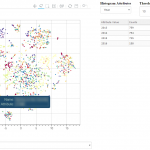
 T-SNE, PCA and other dimensionality reduction algorithms have always been a good way to visualize high-dimensionality datasets. Unfortunately, most of the time, the visualization stops there. If another view of the data is needed, a new chart needs to be computed, projected and displayed.
Toolkits like Bokeh have been a great help to build interactive charts, but the analysis dimension has always been a bit neglected. Last week-end, I took a few hours to glue some Bokeh components together and built an interactive visualization explorer: Chart Miner.
Continue reading “Chart Miner – Exploring 2d Projections”
Tag: coding
A Map of the Geographic Structure of Wikipedia Topics

A large number of Wikipedia articles are geocoded. This means that when an article pertains to a location, its latitude and longitude are linked to the article. As you can imagine, this can be useful to generate insightful and eye-catching infographics. A while ago, a team at Oxford built this magnificent tool to illustrate the language boundaries in Wikipedia articles. This led me to wonder if it would be possible to extract the different topics in Wikipedia.
This is exactly what I managed to do in the past few days. I downloaded all of Wikipedia, extracted 300 different topics using a powerful clustering algorithm, projected all the geocoded articles on a map and highlighted the different clusters (or topics) in red. The results were much more interesting than I thought. For example, the map on the left shows all the articles related to mountains, peaks, summits, etc. in red on a blue base map. The highlighted articles from this topic match the main mountain ranges exactly.
Read on for more details, pretty pictures and slideshows.
Continue reading “A Map of the Geographic Structure of Wikipedia Topics”
Limesurvey: How to import responses from a modified deactivated table
 A good number of my consulting clients use the very useful and powerful survey tool Limesurvey. Unfortunately, since version 1.92+, it seems impossible to reimport deactivated responses tables into new response tables if the survey was modified. I’m sure this doesn’t matter for long form surveys and mainly static surveys, but some of my clients use this platform as a dynamic form engine. In that case, forms can and will change over the duration of a project.
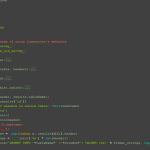
To resolve this problem and enable the importation of old responses tables, I’ve written a quick Python script. It uses MySQLdb, but that library should be installed by default on most Linux boxes. The script also requires a MySQL database backend but it should be easily adaptable to other database engines.
Continue reading “Limesurvey: How to import responses from a modified deactivated table”
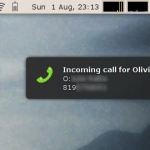
Incoming call popup under Ubuntu and Asterisk
When I worked in a survey firm, I was tasked with building a VOIP system to cut costs and to raise productivity. The biggest productivity drain in an outbound call center is the dialing time and getting someone on the line. By implementing an Asterisk server, we could control and expand the server to our needs. Furthermore, this meant we could have remote workers. We saved a bundle of money in long distance and in fixed costs. The hosted server and the bandwidth itself cost about 80$ a month, while the connectivity to the phone network was negligible and, more importantly, flexible. In other words, if it was a slow month, the cost was low, and conversely, if it was a very busy month, the costs were higher but the money was coming in.

Since it was my server and I was billing the company for it, I figured I could use the same server for my personal phones. So I decided to connect my PSTN numbers to this system. I could now use the server as my private VOIP server.
After configuring the VOIP server to my liking, I started to explore the Asterisk API and related Java and Python bindings. My first module was an interactive IVR system to manage callbacks from the survey outbound number. The callers could know who called them and remove their number from our calling lists.
Update (2012): Modified code for asterisk 1.6
Update (2014): Added code (end of page) for KDE
Continue reading “Incoming call popup under Ubuntu and Asterisk”
Using Crystal Reports with Limesurvey
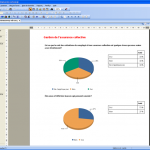
While Limesurvey is a very nice tool to create and manage web surveys, it’s a bit lacking in the reporting area. The functions are a limited and even if you want a quick and dirty, but presentable report, you must export the data and use other tools to format and present the answers to the survey.
While Limesurvey is a very nice tool to create and manage web surveys, it’s a bit lacking in the reporting area. The functions are a limited and even if you want a quick and dirty, but presentable report, you must export the data and use other tools to format and present the answers to the survey.

The problem is the way how Limesurvey stores its data, more specifically the recorded answers. Every column in the table contains theanswer for the question identified by the column and each line (or record) contains a respondent. It seems like a very sensible way to store the respondent’s answers, but the trouble is that it’s very difficult to construct a generic report template in reporting tools with this kind of table schema. To be of any use, the table data have to be converted in a usable form. Furthermore, the schema used by Limesurvey is less than optimal and doesn’t use foreign keys to link tables. This complicates everything.
To convert the answer table data, I’ve written a little python script. It should be pretty plug-and-play. To use it, you have to change the database access variables. The script only takes one argument, the survey id. You can get the survey id in Limesurvey’s administration panel. It should follow the survey title when you select a survey in the administration panel. Continue reading “Using Crystal Reports with Limesurvey”